The Field Guide · No. 43
Odds ratio vs. risk ratio: the gap that grows with risk
An odds ratio and a risk ratio answer different questions and diverge most when the outcome is common, so reading a large odds ratio as if it were a risk ratio can overstate an effect.
Updated
Risk is the straightforward one: the number of people who have an event divided by everyone who could have had it, a plain proportion. Odds is different: the number who have the event divided by the number who do not. A risk ratio, also called relative risk, compares two risks directly; an odds ratio compares two odds. When an event is rare, under about 20% in each group, the odds and the risk are close enough that the two ratios barely differ. As the event gets common, they pull apart.
Researchers often report odds ratios, because they fall naturally out of case-control studies and logistic regression, and then describe them in plain language as though they were risk ratios, 'X% less likely,' 'X times the risk.' For rare outcomes this shortcut is close enough to harmless. The trouble starts when the outcome is common: a 1994 BMJ review of stroke-unit care reported an odds ratio of 0.66 for death or institutionalization in specialist stroke units versus general medical wards, and described it in prose as meaning patients were less likely to die. But the baseline risk of a poor outcome in the comparison group was about 55%, common enough that odds ratio and relative risk stop being interchangeable.
The arithmetic makes the gap explicit. An odds ratio of 0.66 read as though it were a relative risk implies a reduction in poor outcomes of about a third (1 minus 0.66). Worked through properly from the 55% baseline risk, that same odds ratio of 0.66 actually corresponds to a relative risk of 0.81, a reduction of about a fifth, not a third, an overstatement of nearly double. Two traps follow. First, the overstatement always runs the same direction: an odds ratio below 1 makes a benefit look bigger than the true risk reduction, and an odds ratio above 1 makes a harm look bigger than the true risk increase, never the reverse. Second, the gap grows with baseline risk, not with the odds ratio alone: at a baseline risk of 5%, odds of 0.053 sit close to the risk itself, but at a baseline risk of 90%, odds of 9 bear little resemblance to it, so the identical odds ratio can be a fair stand-in for the risk ratio in one study and a serious overstatement in another, depending only on how common the outcome was to begin with.
So when a headline or an abstract quotes an odds ratio, especially one built on a common outcome like readmission, complication, or default, check the baseline risk before repeating the ratio as a plain 'X% more or less likely' claim. An odds ratio from a rare-outcome study, under about 20% baseline risk, can usually be read as a relative risk without much distortion. One from a study where more than half the comparison group had the outcome cannot. Pair a striking odds ratio with a look at how common the outcome was in the comparison group, the same way you would check a relative risk against its absolute baseline.
What to remember
- Risk is a plain proportion; odds is the ratio of having an event to not having it. The two measures, and their ratios, only stay close when the outcome is uncommon.
- A 1994 review of stroke-unit outcomes reported an odds ratio of 0.66, described in plain language as a reduction of about a third, but at the study's 55% baseline risk the true relative risk was 0.81, a reduction of about a fifth.
- The gap between odds ratio and risk ratio grows with baseline risk, not the ratio alone; below about 20% baseline risk the two are close, above 50% they can diverge sharply.
From the record
If the odds ratio is interpreted as a relative risk it will always overstate any effect size: the odds ratio is smaller than the relative risk for odds ratios of less than one, and bigger than the relative risk for odds ratios of greater than one.
Asked often
What is a real example of an odds ratio being read as if it were a risk ratio?
A 1994 BMJ review of stroke-unit care reported an odds ratio of 0.66 for death or institutionalization and described it as patients being less likely to die. Because the baseline risk of a poor outcome was about 55%, common rather than rare, the true relative risk worked out to 0.81. Reading the odds ratio as a relative risk suggested a reduction of about a third, when the real reduction was closer to a fifth.
When is it safe to treat an odds ratio as a relative risk?
When the outcome is uncommon, roughly under 20% baseline risk in the comparison group, the odds and the risk are close enough that the odds ratio and the relative risk barely differ. Above that, and especially once the baseline risk passes 50%, the gap can become large enough to change how big an effect looks, even though it rarely changes whether the effect looks real.
Further reading
Go deeper
Paid link. If you buy a book through this link, Bookshop.org pays us a small commission and sends a share of the sale to independent bookstores.
-
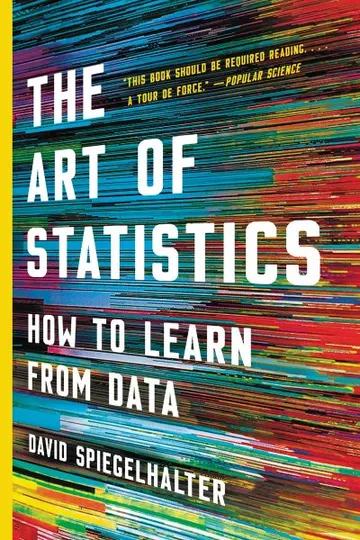
The Art of Statistics (opens Bookshop.org)
David Spiegelhalter · 2019
David Spiegelhalter explains relative risks and odds ratios with health examples, and shows how different ways of stating the same result can change how large it sounds.
Read the news better, every morning.
We send you the day's real progress in science, medicine and beyond, told plainly and sourced. Free, forever.
Free forever, no spam. One click to unsubscribe, and we never sell your email.